Business Problem
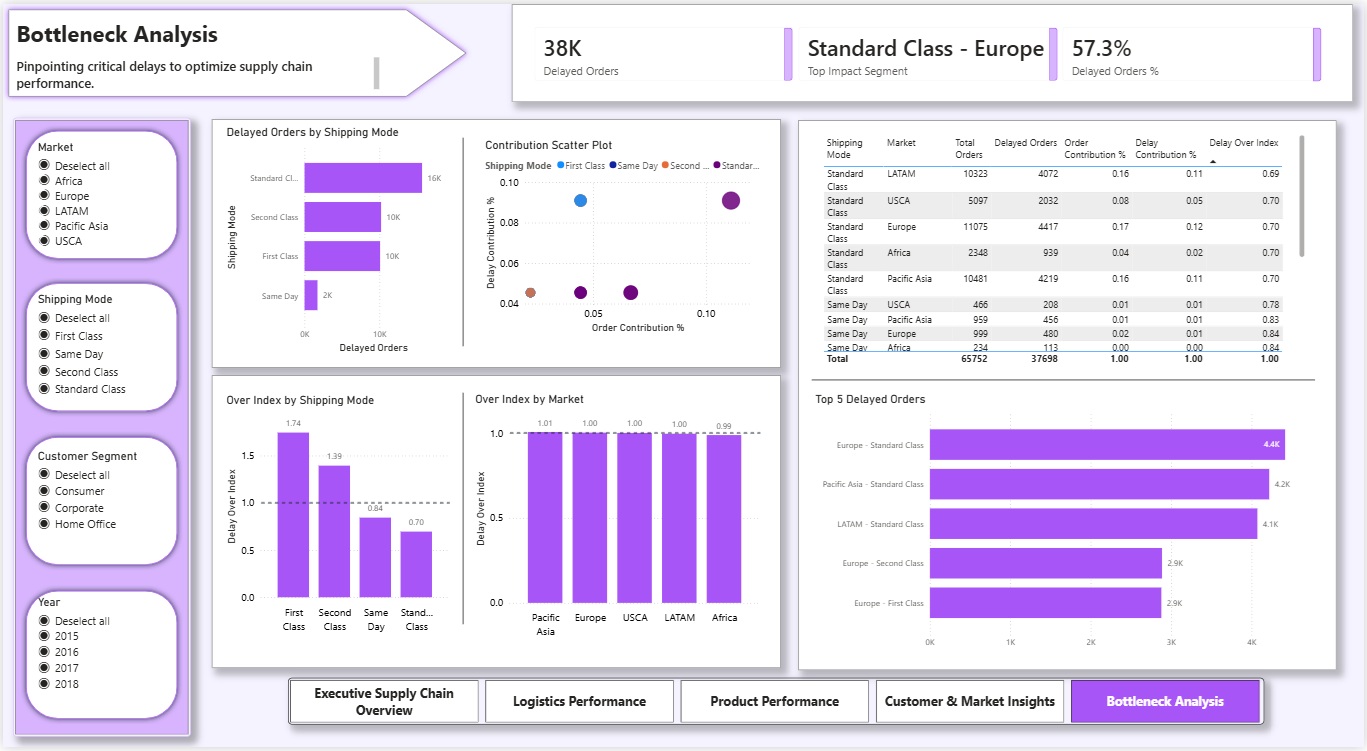
Nearly 57% of orders were delivered later than scheduled, indicating widespread fulfillment challenges across the entire supply chain network.
The goal was to identify where delays have the highest business impact and prioritize operational improvements at the most critical leverage points.
Key Insight
While premium shipping modes show higher relative delays, the majority of delayed orders are driven by high-volume Standard Class shipments.
A small number of high-volume segments — primarily Standard Class shipments in Europe and Asia — account for a disproportionately large share of total delays.
Targeted improvements in these segments can significantly reduce overall delays — this concentration is the opportunity.
Share of total delayed volume by shipping class
Dashboard Preview
An interactive Power BI dashboard surfaces real-time KPIs, delay breakdowns, and segment-level drill-downs across 180K+ records.
Top Bottlenecks
A contribution vs. over-index analysis pinpoints exactly which segment × region combinations demand immediate operational attention.
Analytical Approach
Key Findings
~57% of orders are delayed — indicating systemic operational issues across the network, not isolated incidents.
Standard Class drives the majority of delays by volume — even a small improvement here has outsized impact on overall performance.
First Class shows higher inefficiency but lower absolute impact — useful for premium SLA optimization separately.
Revenue follows a long-tail distribution — a small segment of customers drives a disproportionate share of total revenue.