Uncovering revenue drivers, product concentration, and delivery performance insights through advanced data analytics
DATASET
Blinkit Orders
Grocery delivery data
ORDERS ANALYZED
5,000+
Complete transactions
TOOLS USED
Power BI
DAX • Star Schema
KEY FINDING
30.6%
Orders delayed
Blinkit operates a fast-delivery grocery model where operational efficiency and product mix significantly affect revenue performance. The objective of this analysis was to understand how revenue is distributed across products, customers, and delivery performance, and whether delivery delays influence order value or revenue exposure.
The analysis was built using a star schema to create a scalable semantic model for reporting and KPI calculations. A central fact table stores order-level transactions while dimension tables capture customer, product, and time attributes.
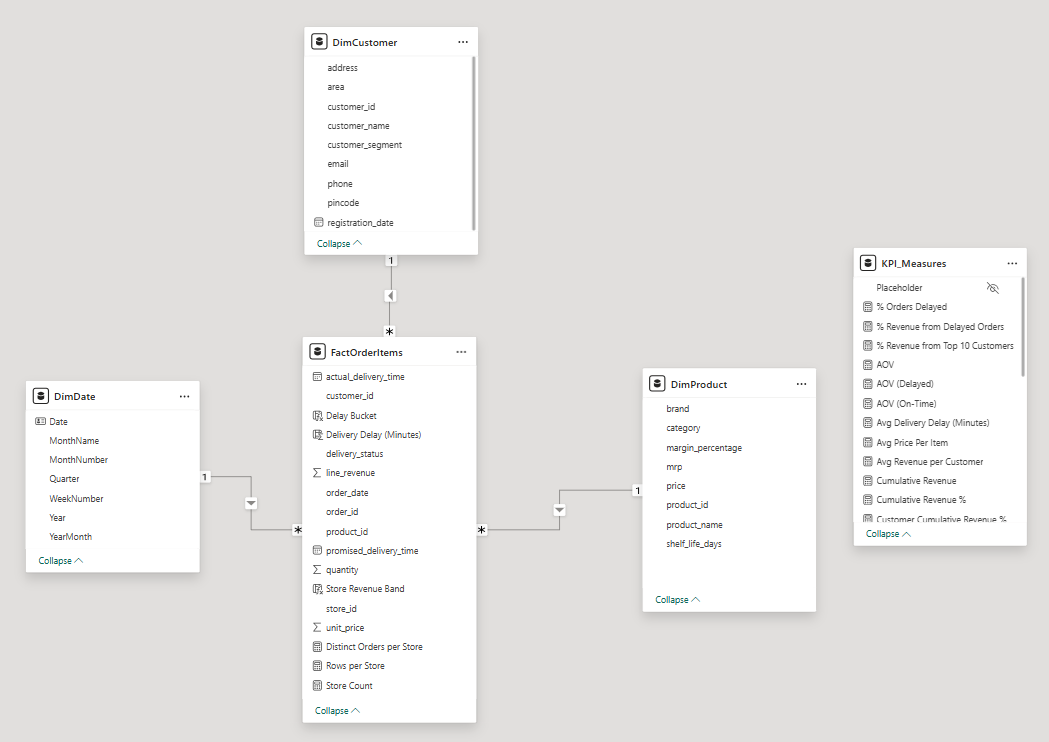
Star Schema Diagram
Fact Table ← Dimension Tables: Customers, Products, Time, Stores
A semantic metric layer was implemented using DAX measures to standardize KPI definitions across the Power BI report.
Average Order Value (AOV)
DIVIDE(
  [Total Revenue],
  DISTINCTCOUNT(
    FactOrderItems[order_id]
  )
)
Orders Delayed %
DIVIDE(
  [Delayed Orders],
  [Total Orders]
)
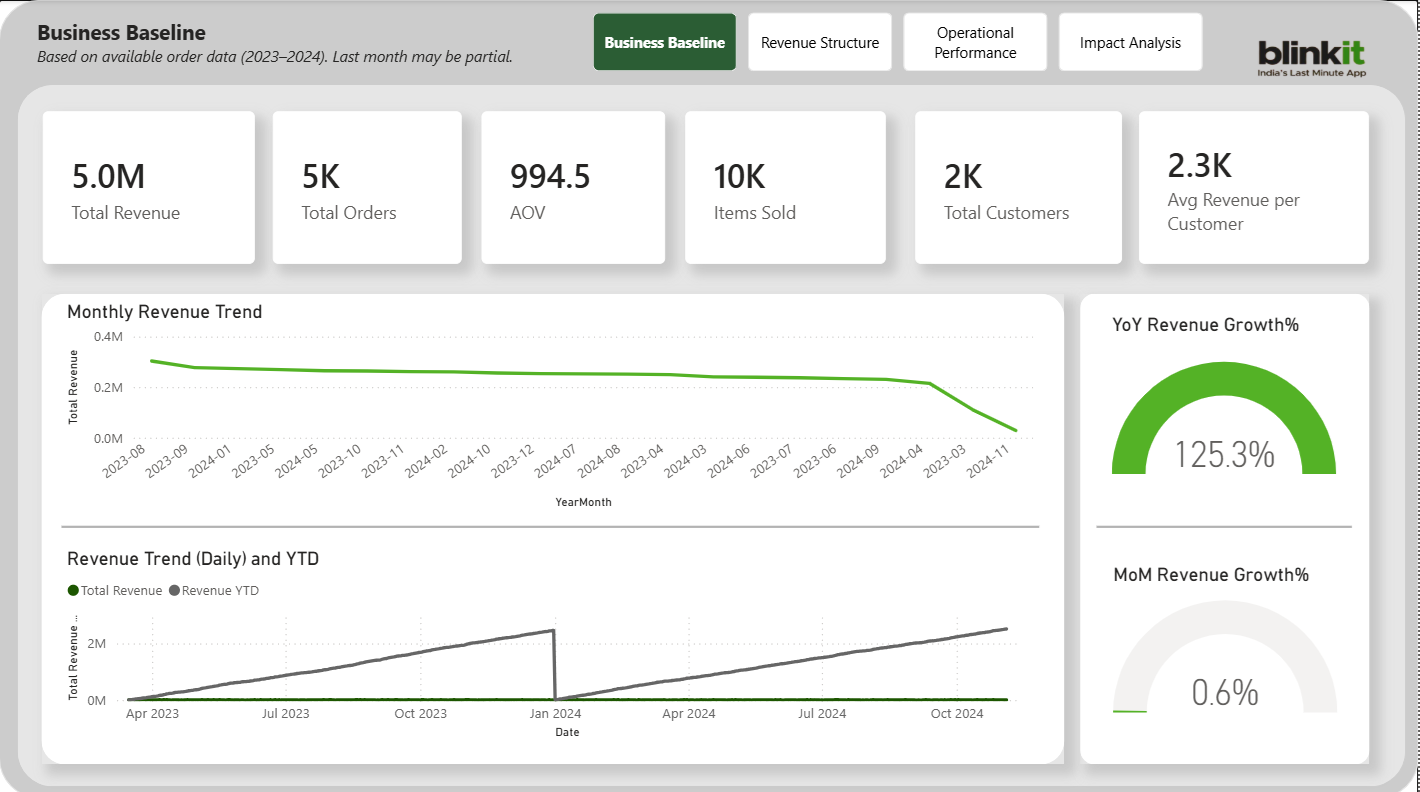
Business Baseline
KPI tracking and performance metrics
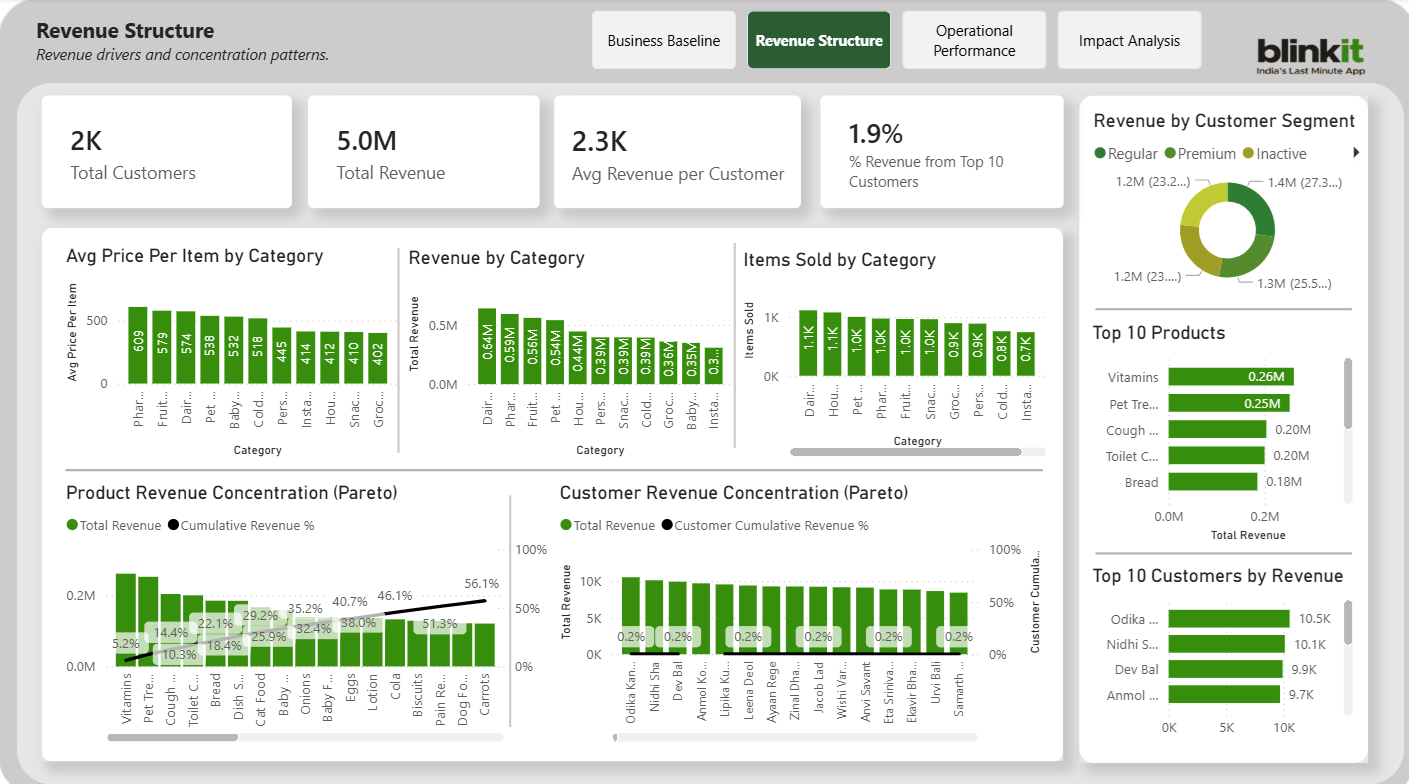
Revenue Structure
Product mix and revenue distribution
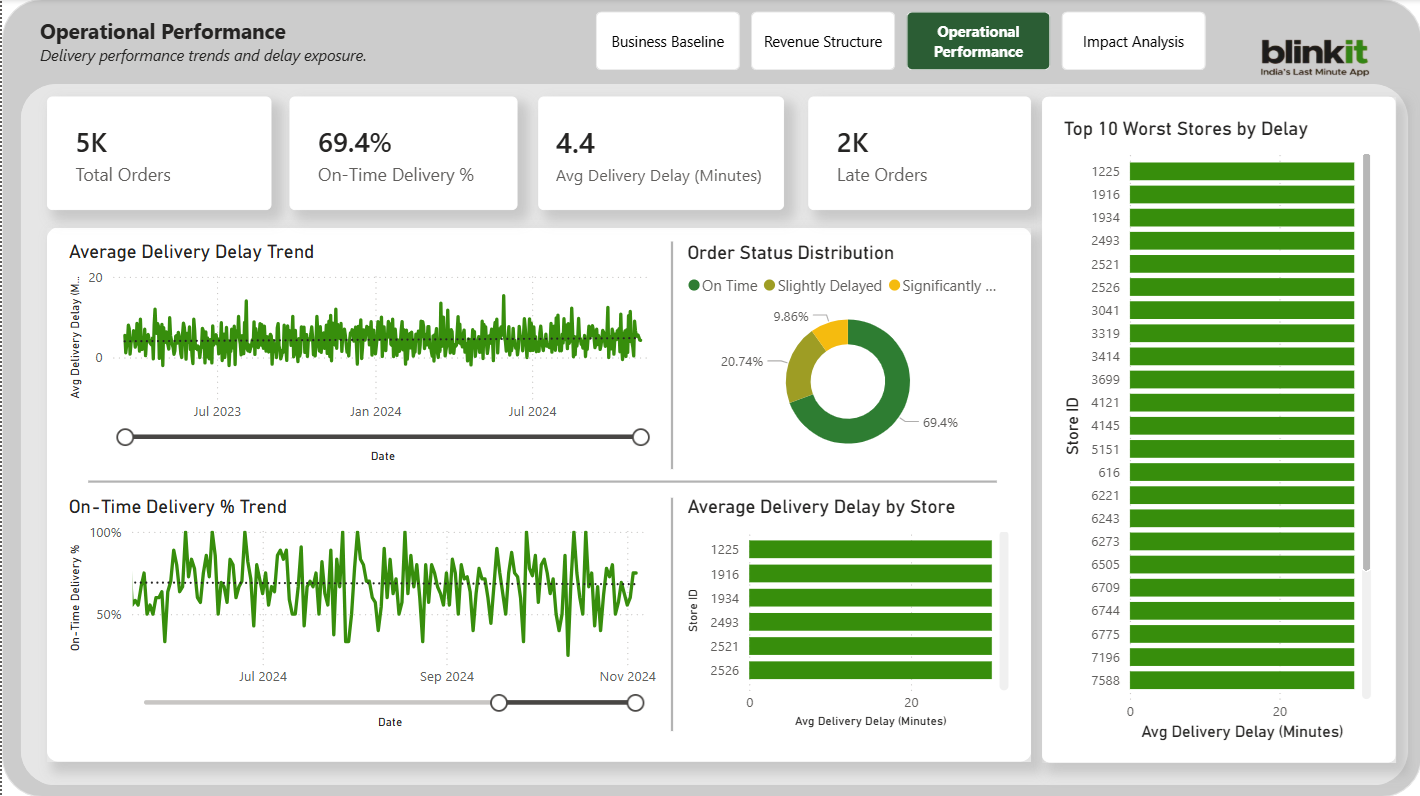
Operational Performance
Delivery delays and store performance
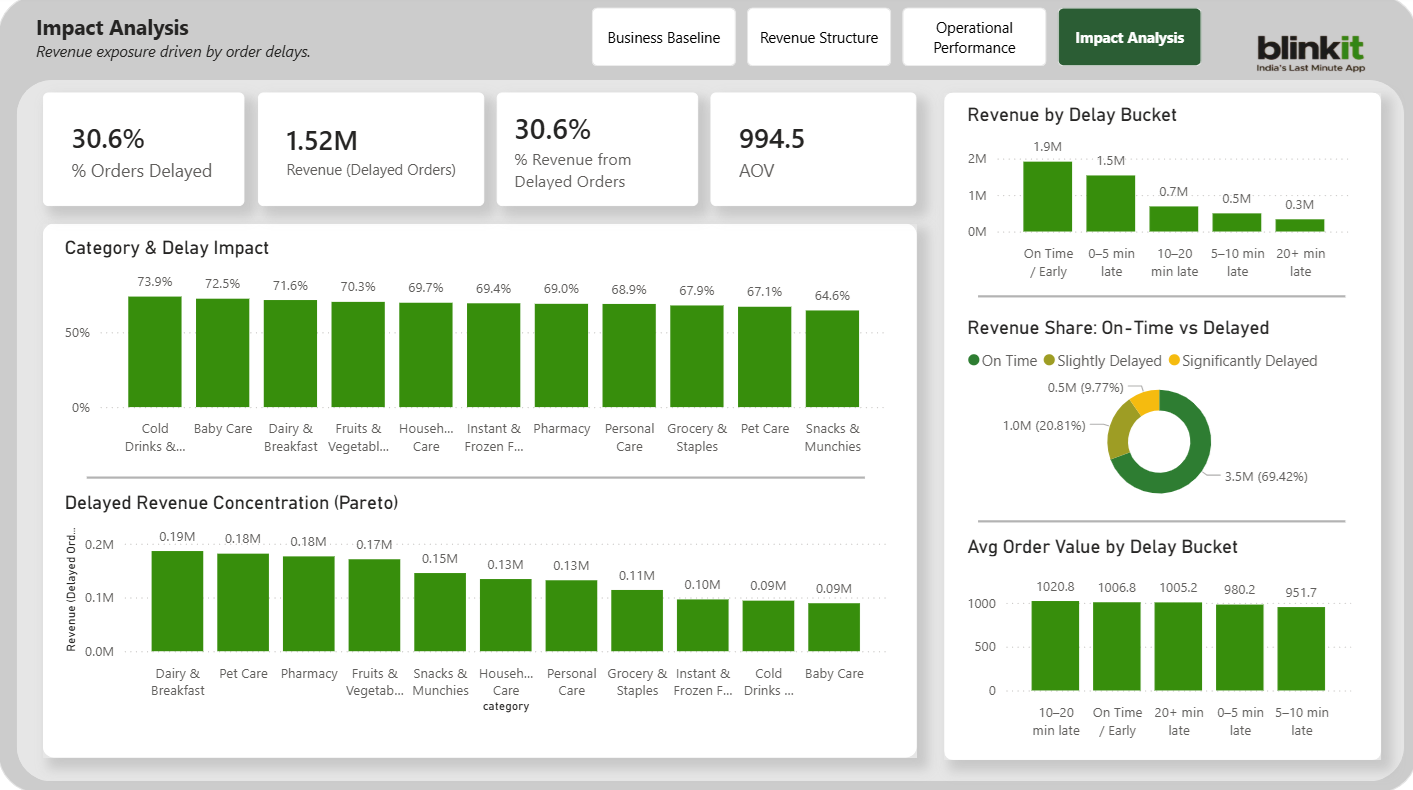
Impact Analysis
Delay impact on AOV and revenue